Historical Data
Daily U.S. Stock Returns
Annual U.S. Stock Returns
Long Term U.S. Stock Returns
Long Term U.S. Bond Returns
Diversification
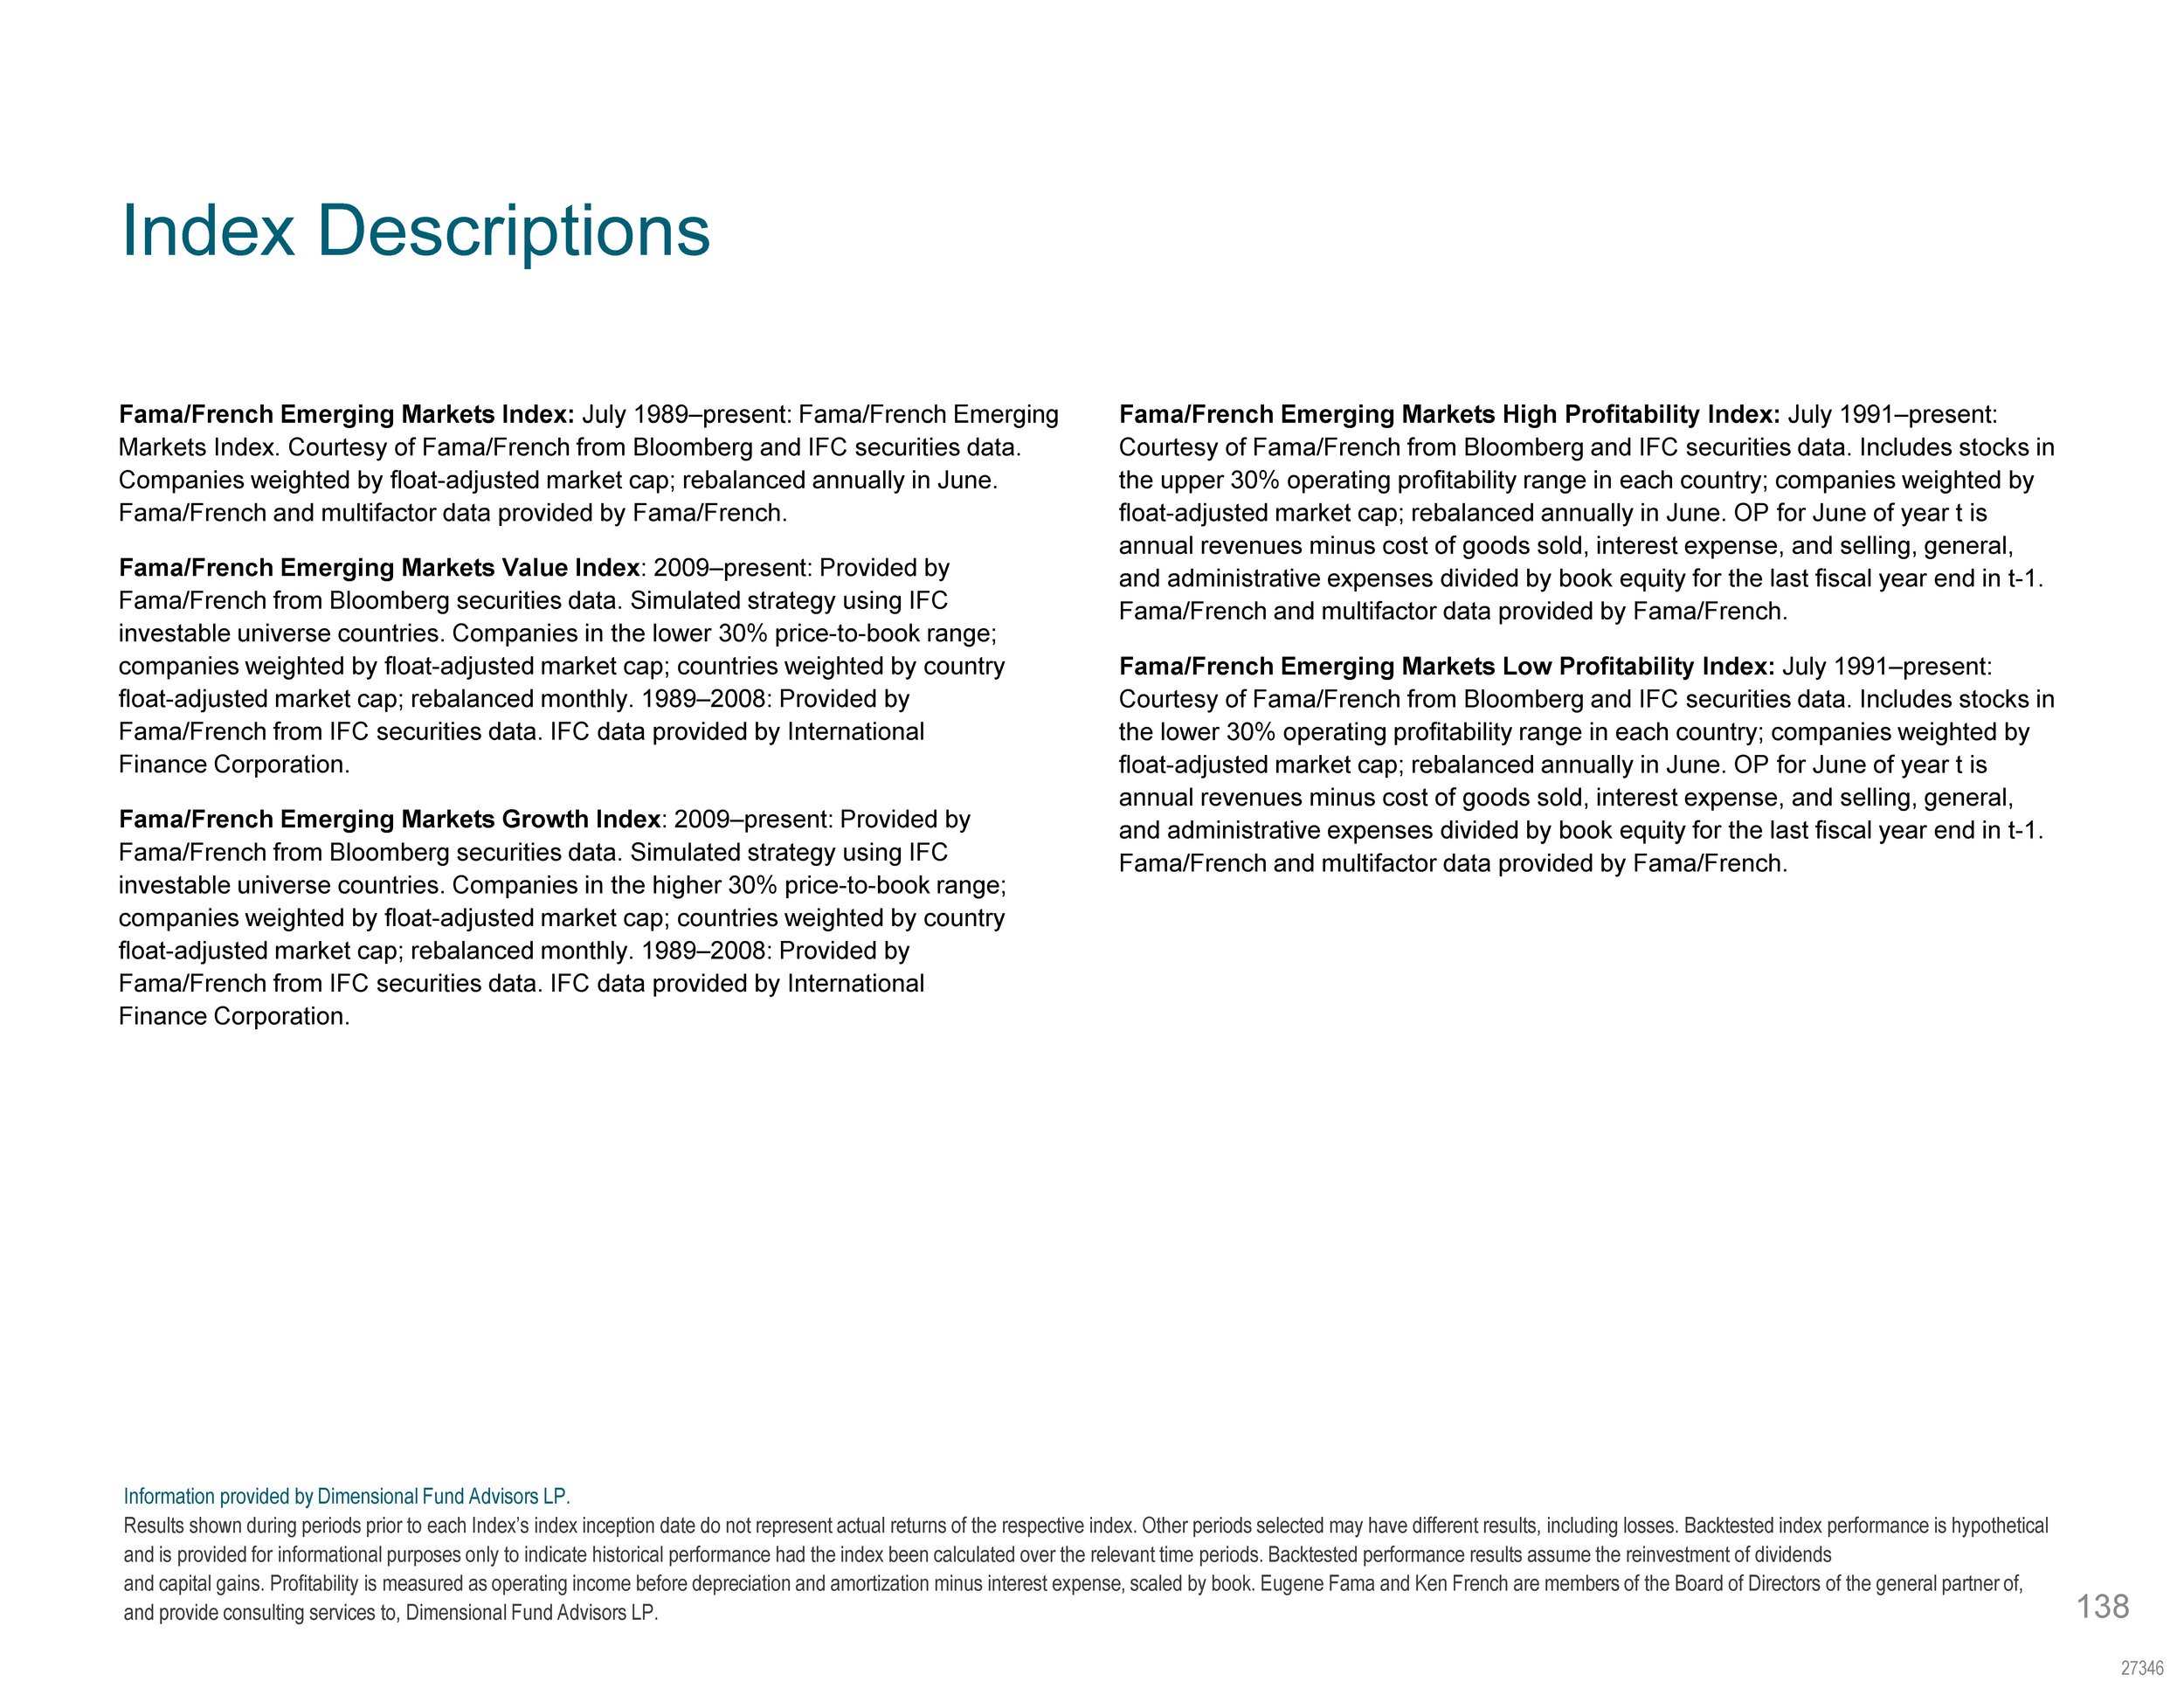
Global Market Returns
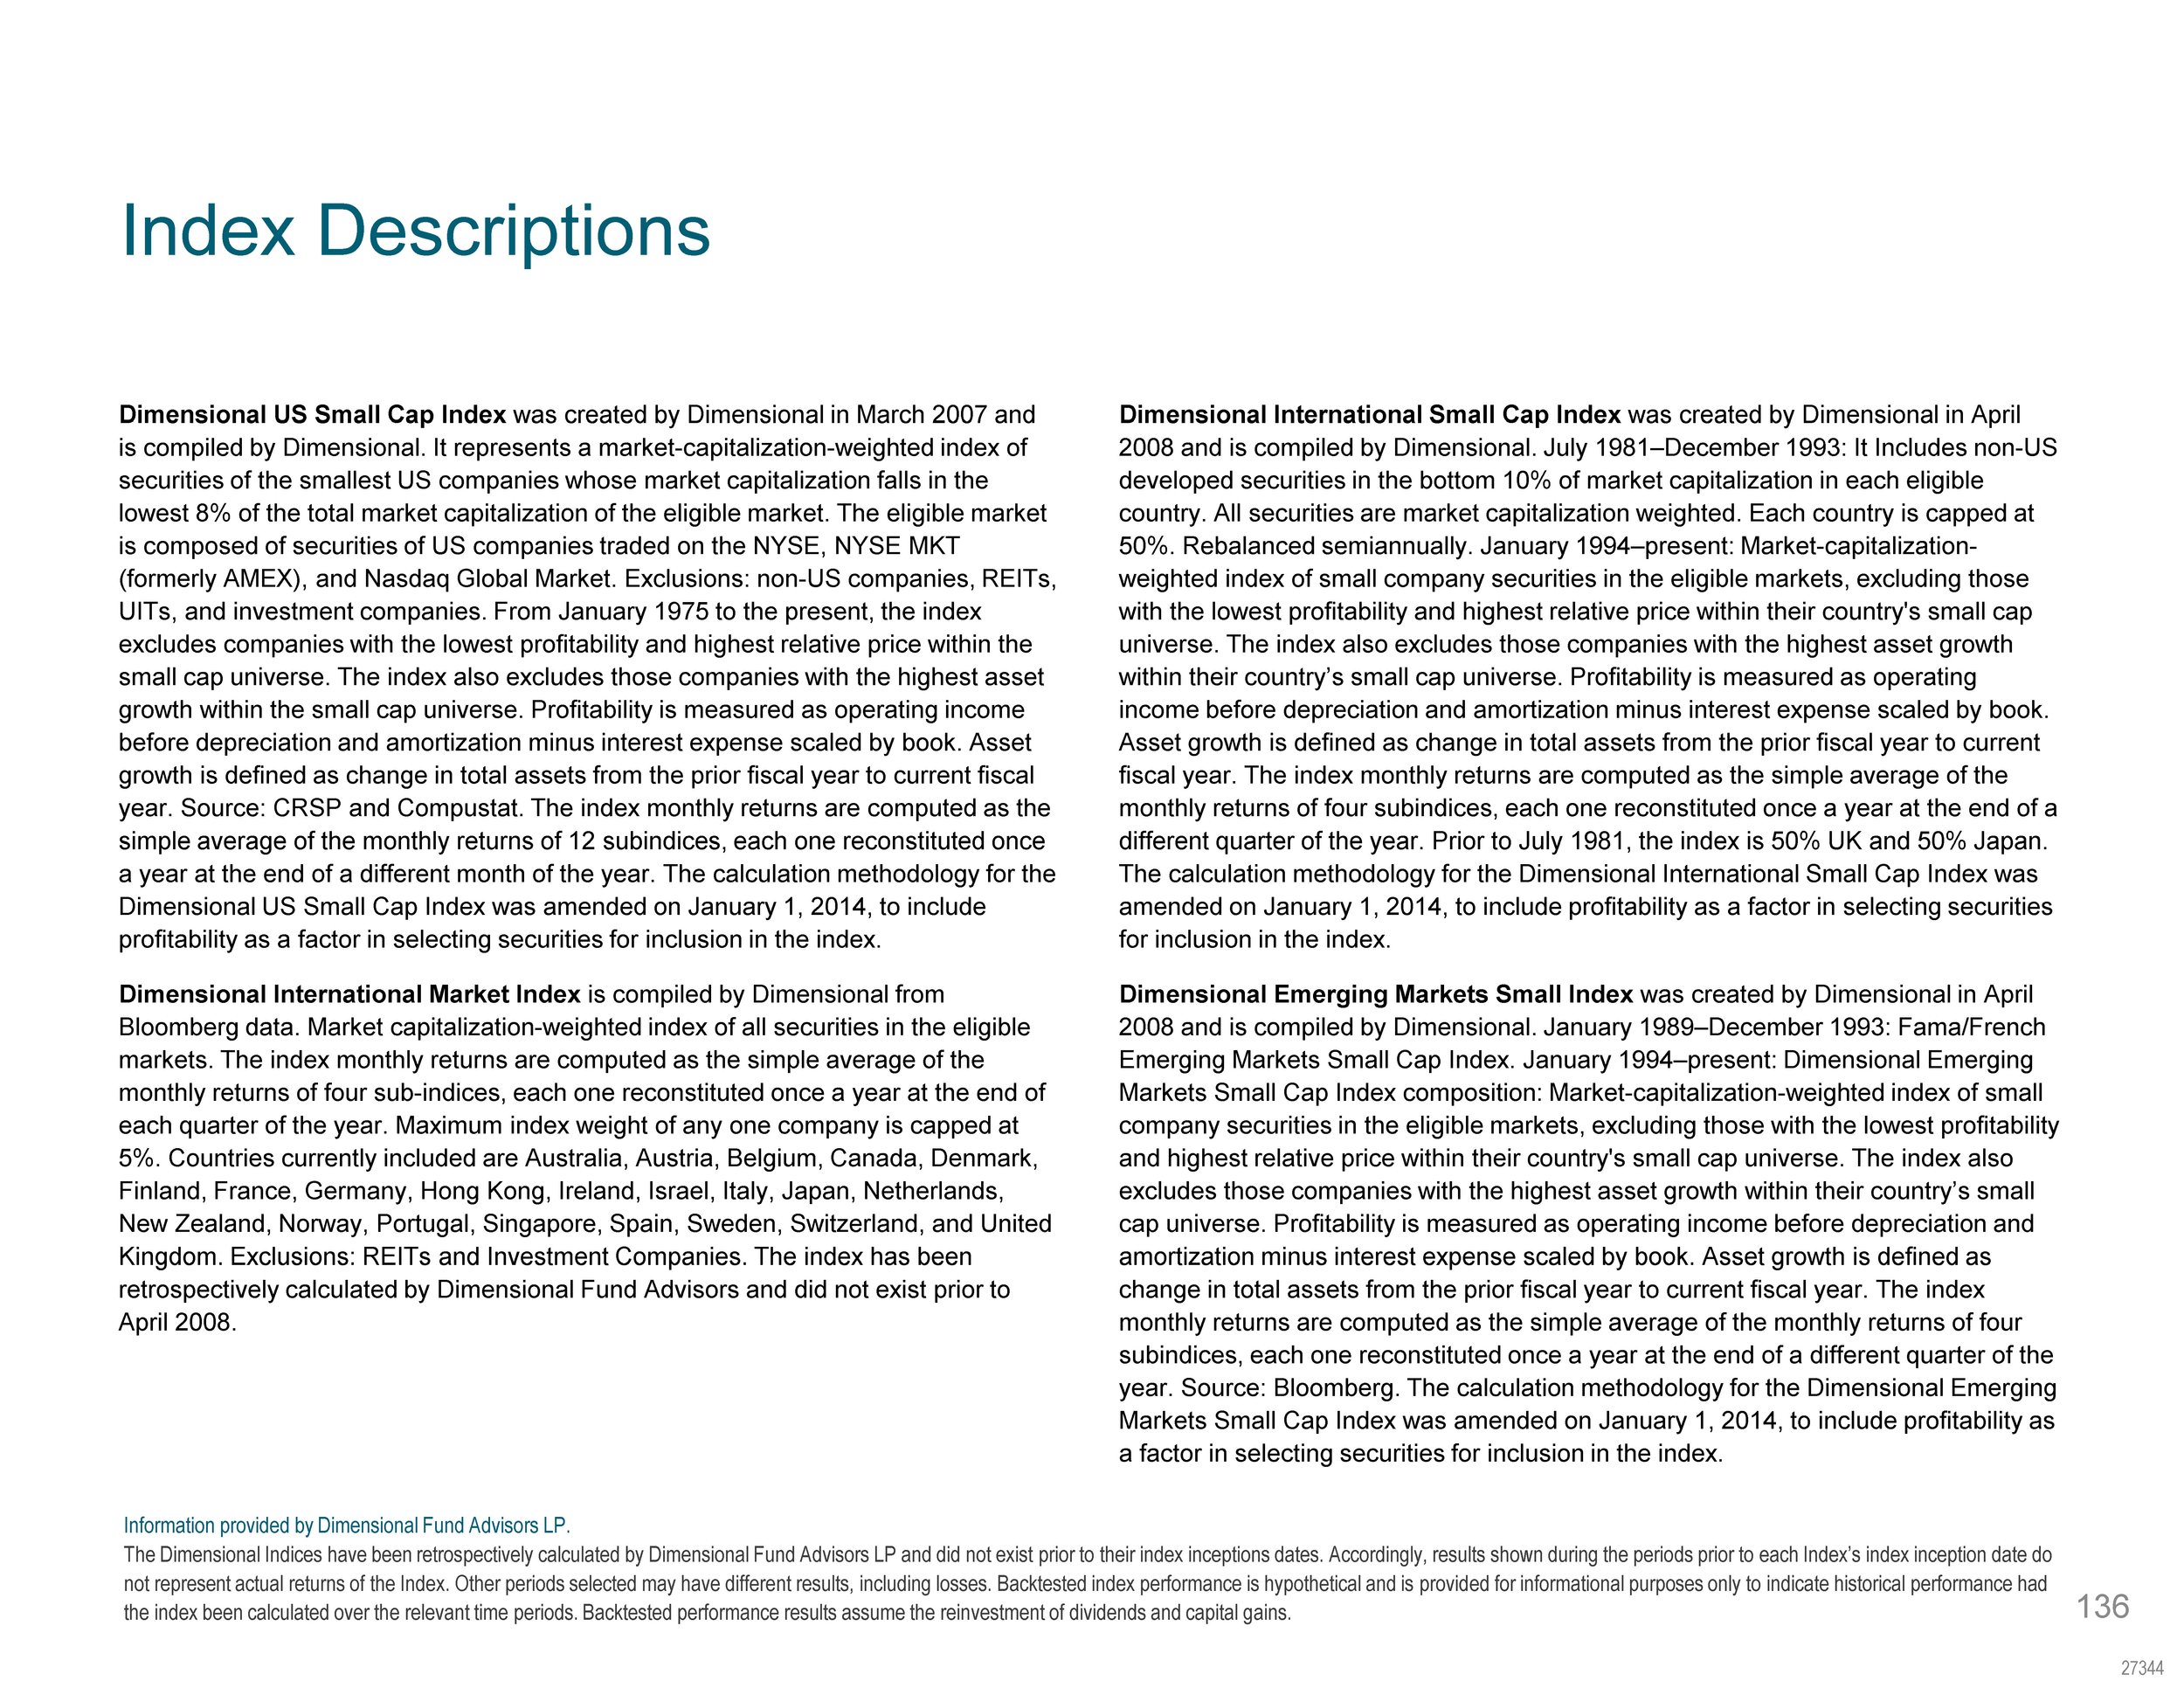
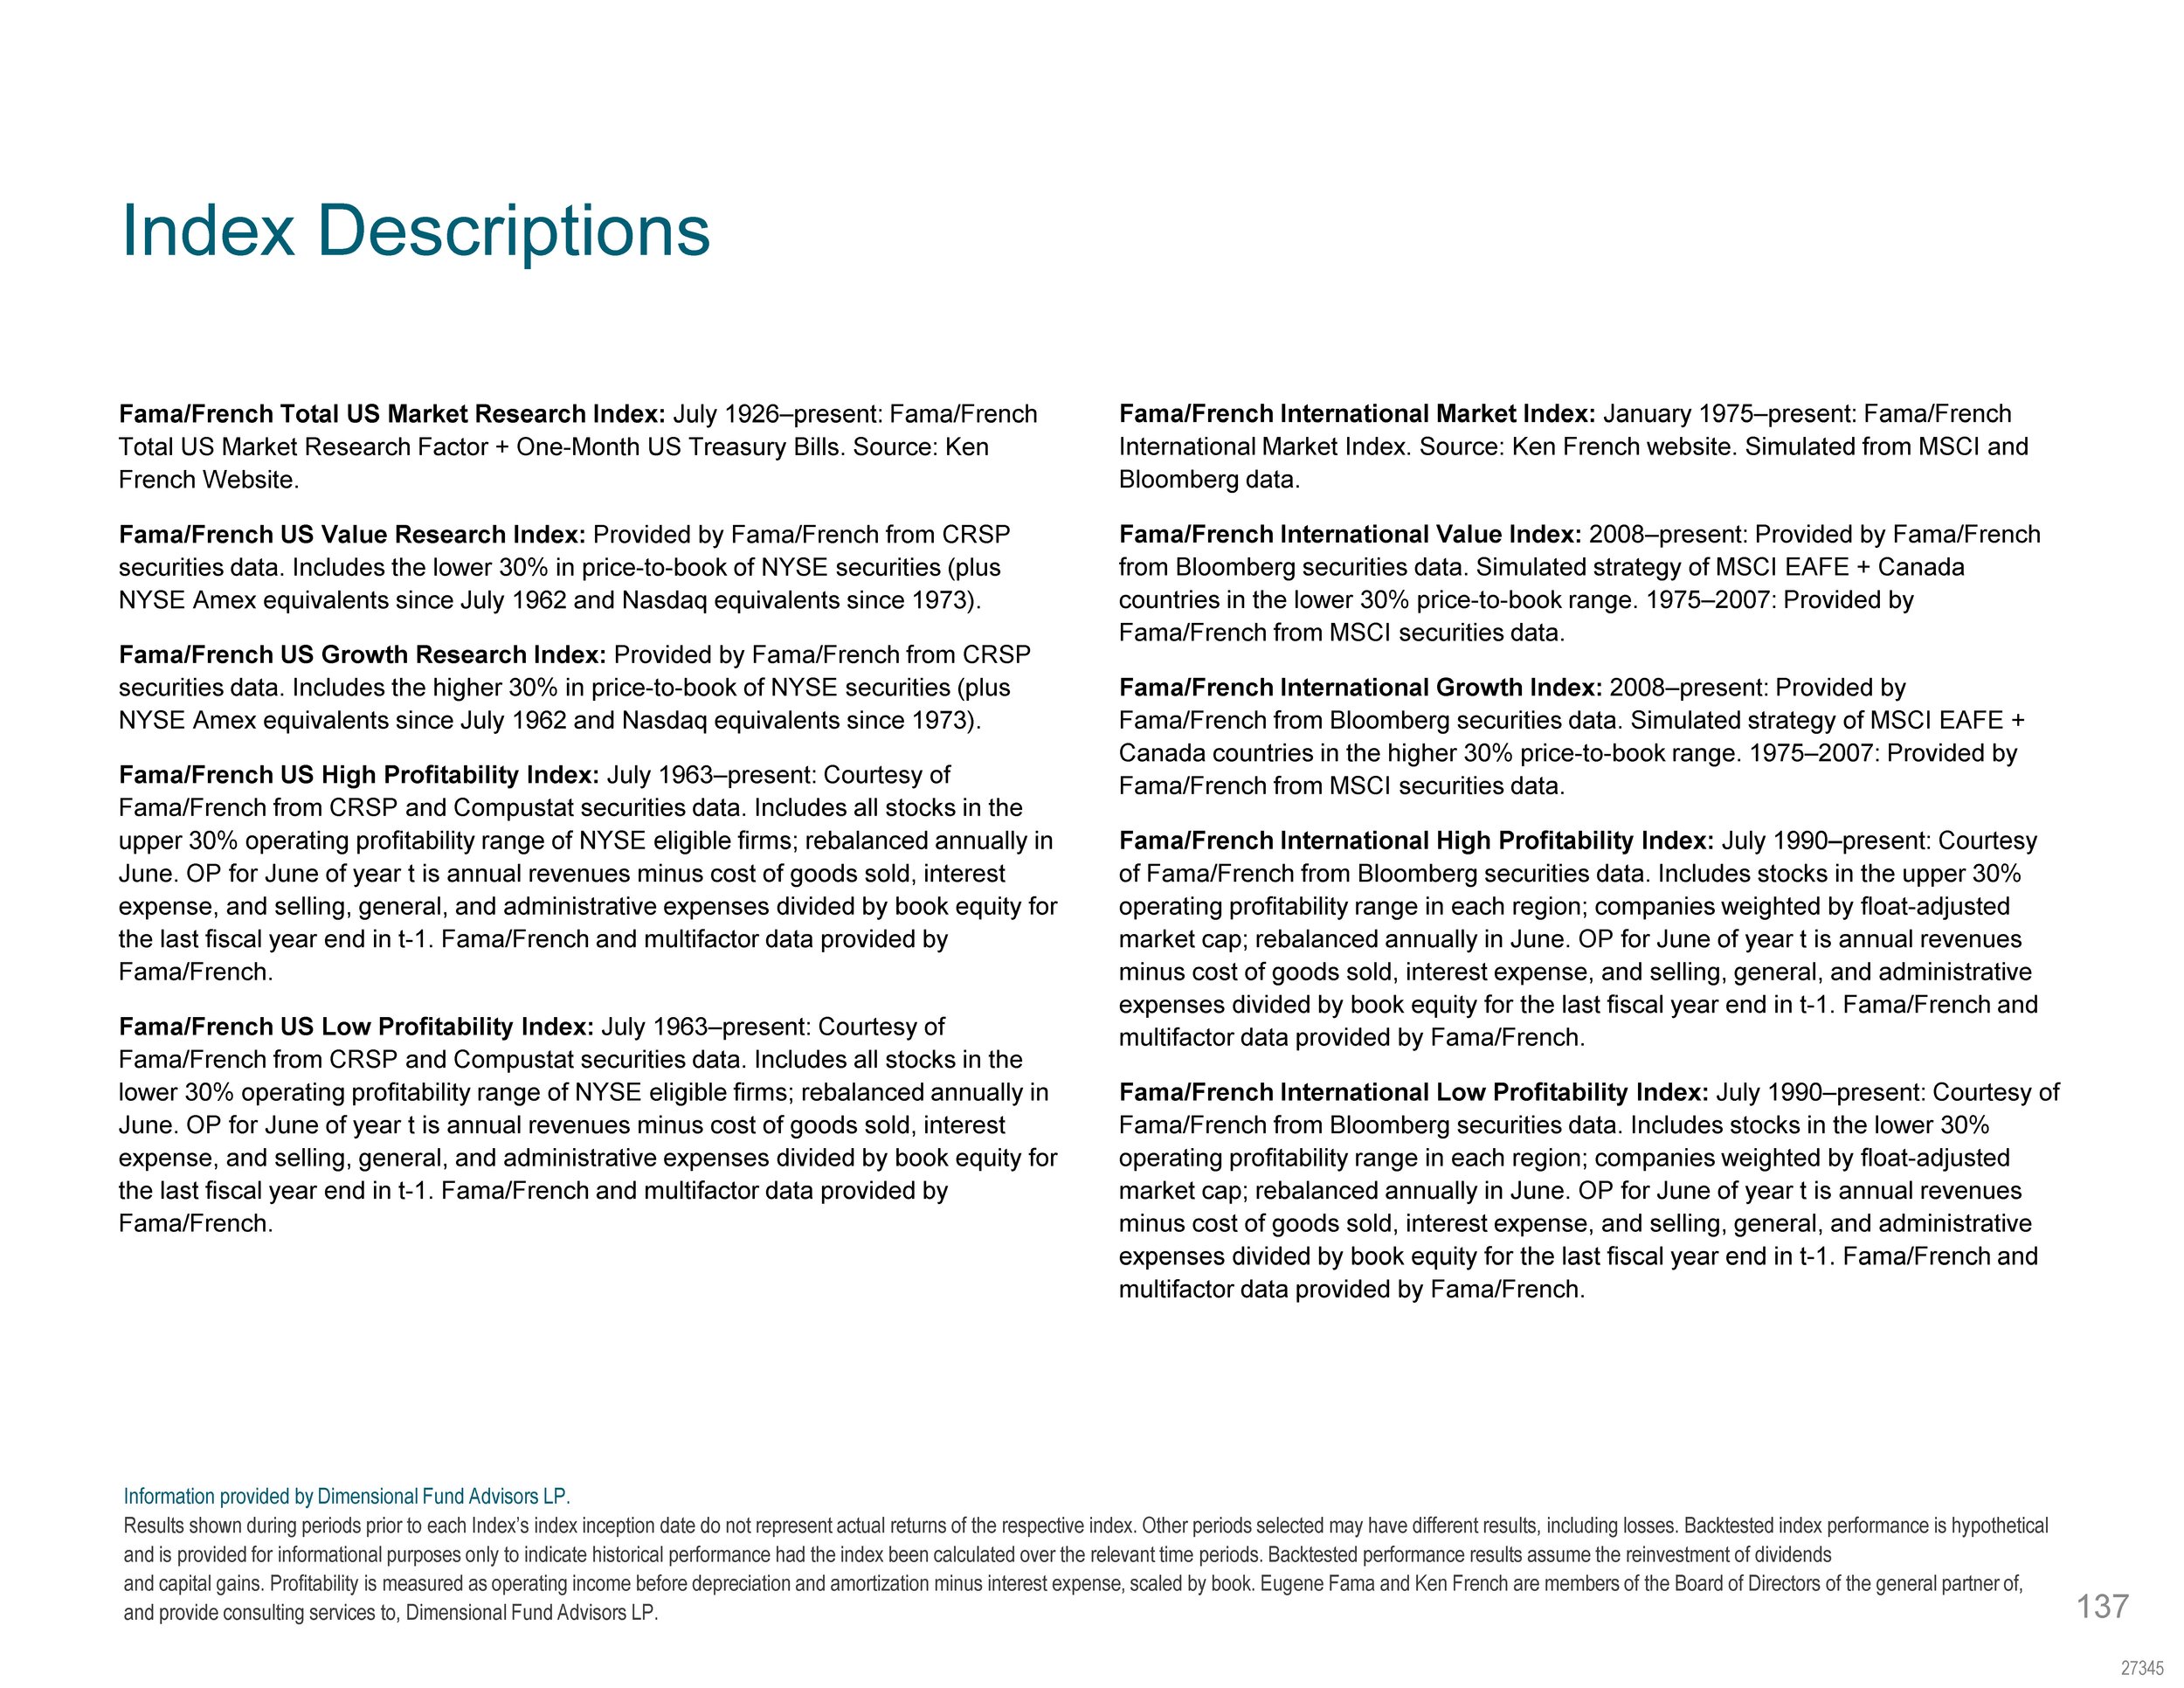
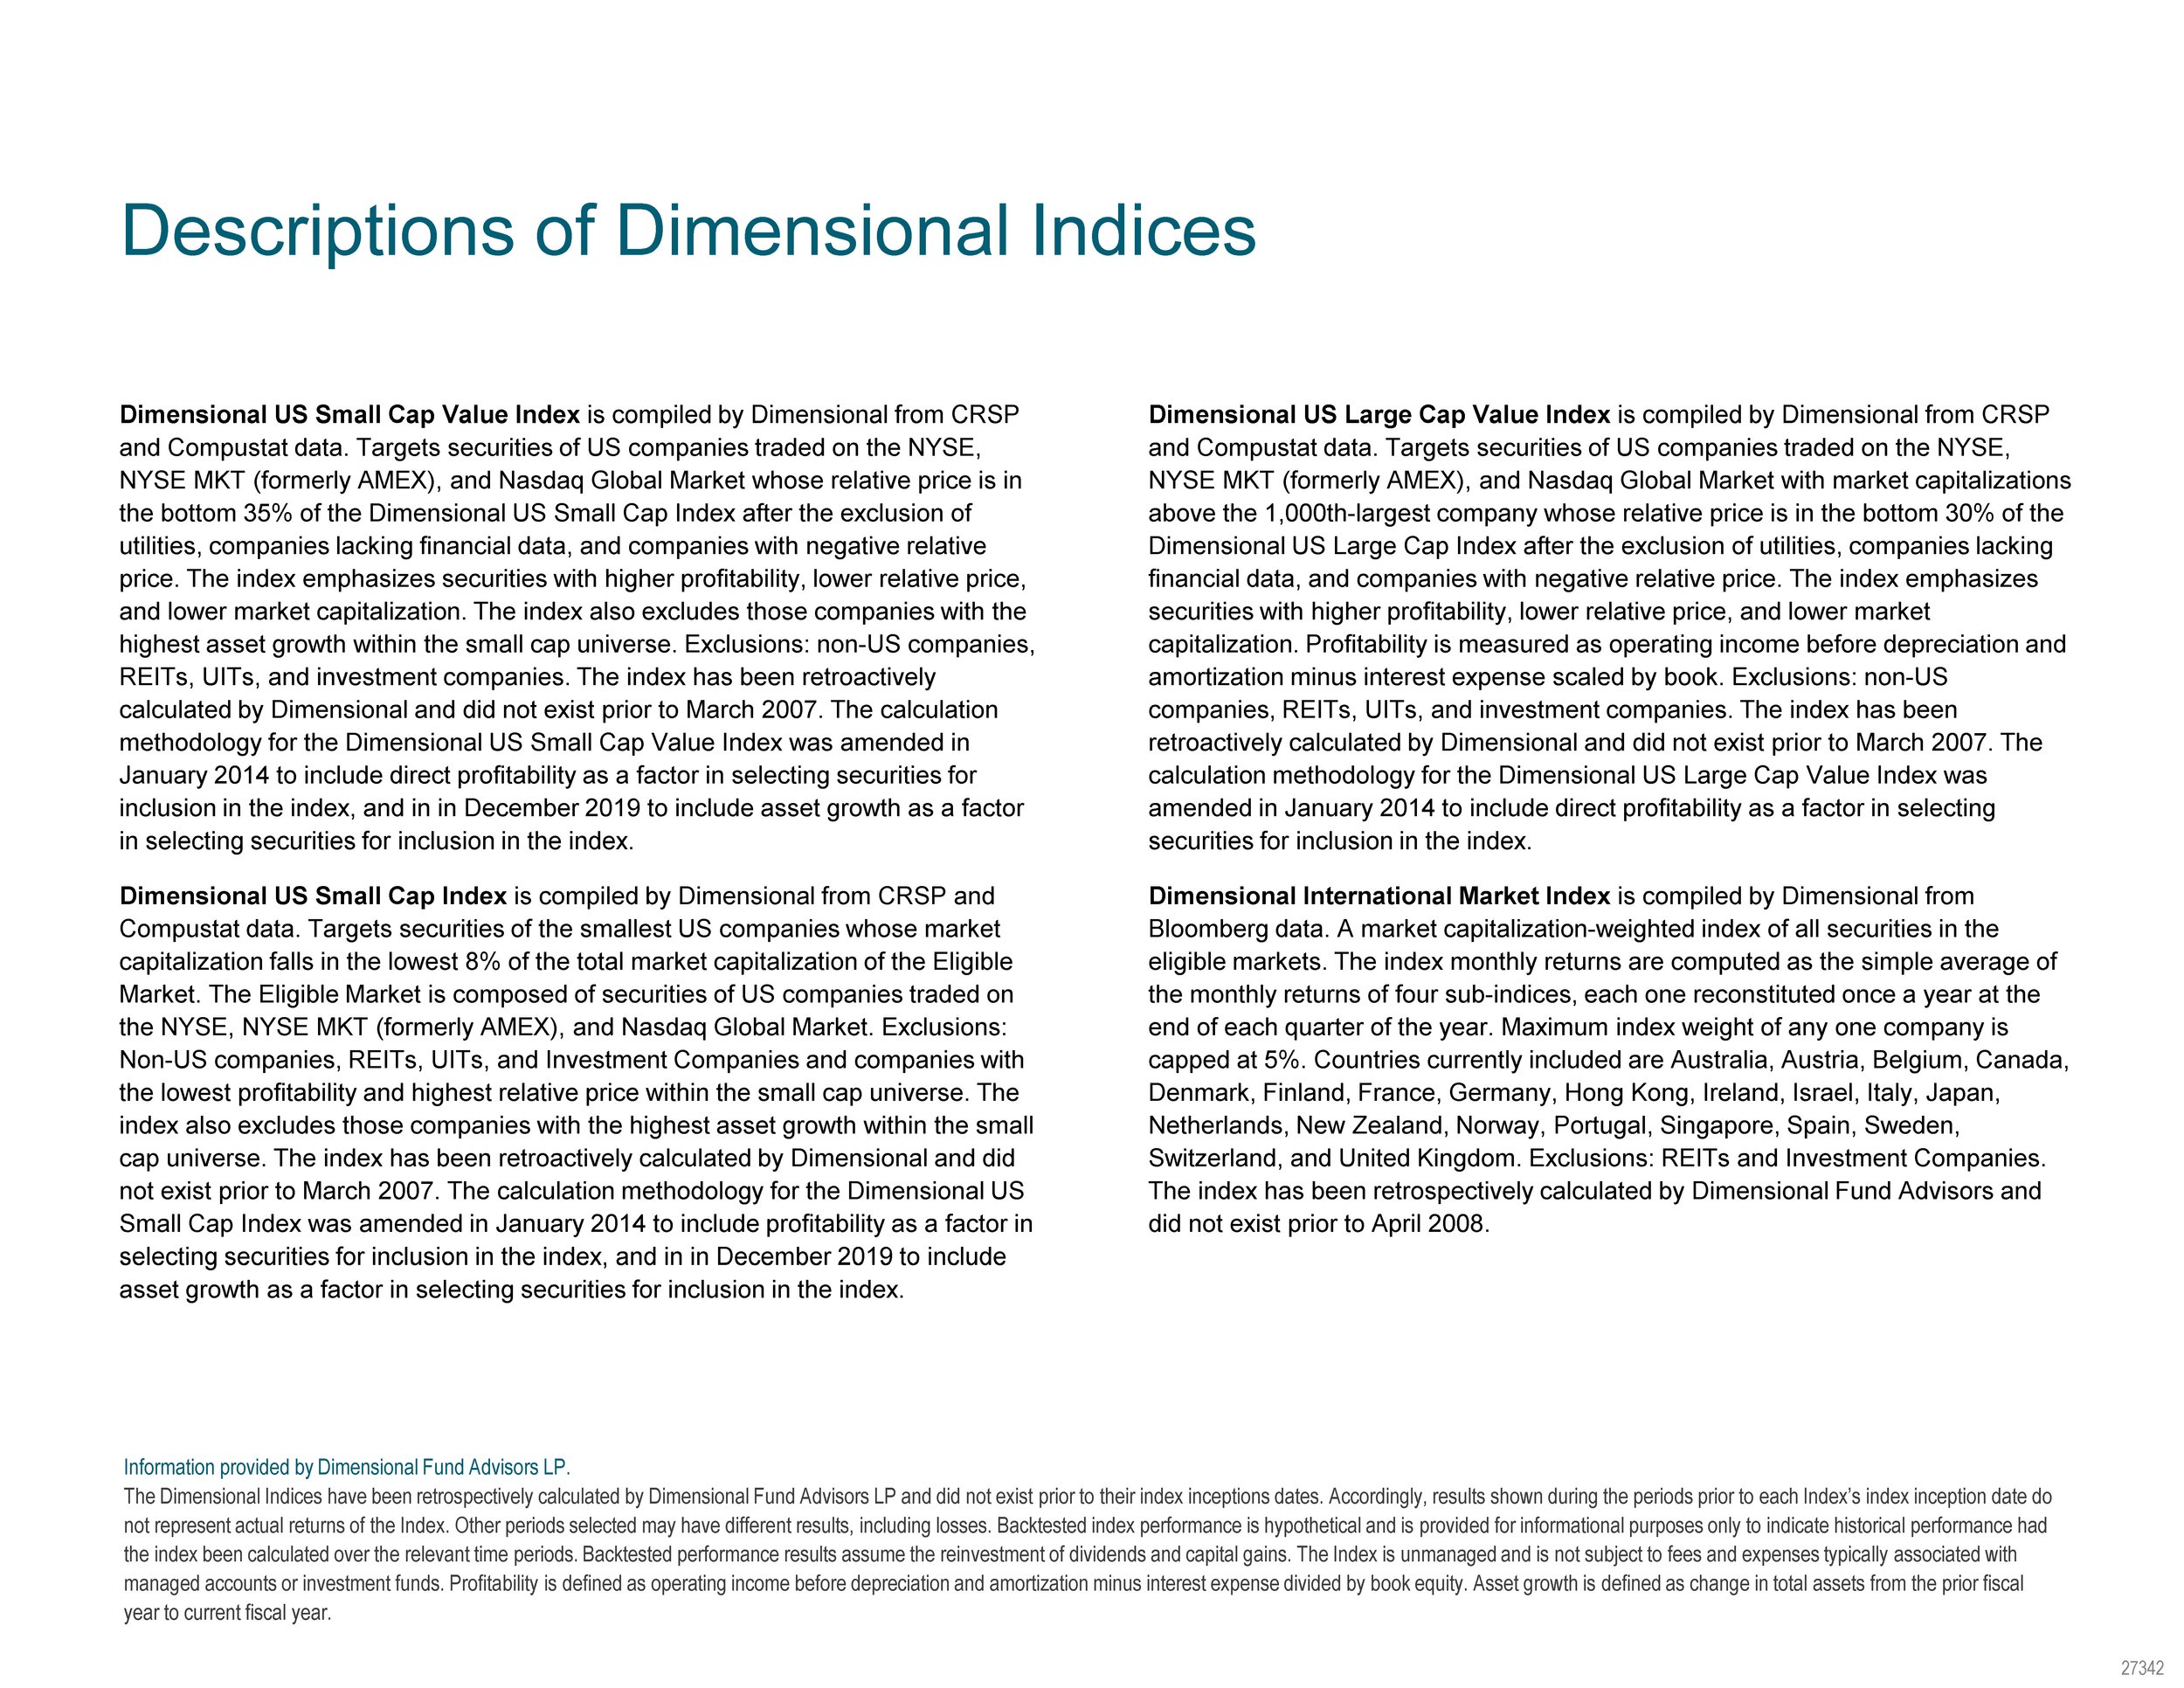
Dimensions Of Returns
Volatility
10 Year U.S. Treasury Yields
S&P 500 Historical Prices
S&P 500 Dividend Yield
Price/Earnings Ratio for S&P 500 Stocks
Shiller Cyclically Adjusted Price/Earnings (CAPE) Ratio For U.S. Stocks
U.S. Inflation Rate
Commodities
Currencies
Cryptocurrencies
Bitcoin vs. Russell 3000 Stock Index
Peak-to-Trough Declines / August 2, 2010–December 31, 2024
Past performance is not a guarantee of future results.
Russell data is in USD. Peak-to-trough declines shown are the cumulative negative returns from the prior peak. Peak is defined as the highest index level prior to a given day. The sample start date is based on the earliest available Bitcoin price data, which begins on August 2, 2010, representing the first recorded market price for Bitcoin. Price peaks and troughs are sourced from Bloomberg. Certain Bitcoin offerings may be considered a security and may have different attributes than those described. Dimensional does not offer investment in Bitcoin or cryptocurrency. Frank Russell Company is the source and owner of the trademarks, service marks, and copyrights related to the Russell Indexes. Indices are not available for direct investment; therefore, their performance does not reflect the expenses associated with the management of an actual portfolio.
Appendix: Selected Data Sources
